
… as allocation crisis hits gas-to-power, industries, transport, households amid rising supply to NLNG
“Gas crisis in Q1,26 is about where the molecules go, at what price, to whose benefit…. power, manufacturing, households are bearing cost of an allocation trend that PIA was designed to prevent” – Barrister Ezeude
Oredola Adeola
Nigeria’s gas market in the first quarter (Q1) of 2026 revealed a widening structural imbalance, with average supply steady at 4.832 bscf/day, but allocations increasingly skewed toward exports—leaving power generation, industries, and households under pressure.
This was revealed in Advisors Reports’ analysis of the Fact Sheet on the State of the Midstream and Downstream Sector for January, February, and March 2026, released by the Nigerian Midstream and Downstream Petroleum Regulatory Authority (NMDPRA).
The factsheet showed that while production remained relatively stable—January (4.837 bscf/day), February (4.771 bscf/day), and March (4.888 bscf/day)—domestic utilization steadily weakened as export demand intensified.
At the center of this shift is NLNG Limited, which saw gas supply to its six (6) operational trains rise consistently from 2.931 bscf/day in January to 3.018 bscf/day in February and 3.033 bscf/day in March.
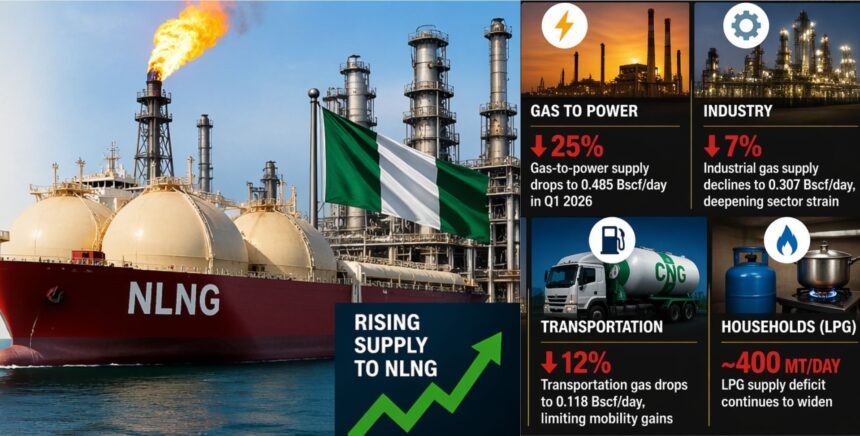
By March, NLNG alone accounted for about 62% of total gas supply, significantly tightening volumes available for domestic use.
In contrast, average. daily gas supplied to domestic market dropped to 1.906 bscf/day in January, 1.763 bscf/day in February, and 1.855 bscf/day in March, indicating that the local market is increasingly treated as a balancing segment—absorbing cuts whenever export demand rises.
Nowhere is the impact more pronounced than in the sharp decline in gas allocations to thermal power plants nationwide—driven primarily by allocation and offtake decisions rather than any underlying supply shortage.
Gas-to-power supply declined sharply by 25% within one quarter, dropping from 0.648 bscf/day in January to 0.536 bscf/day in February and 0.485 bscf/day in March.
This contraction directly correlates with persistent grid instability and electricity shortfalls nationwide witnessed during the quarter.
Average daily gas supply to industrial users remained largely flat—0.431 bscf/day in January, 0.440 bscf/day in February, and 0.430 bscf/day in March—indicating that constraints on manufacturing and petrochemical output stem less from infrastructure limitations and more from inconsistent allocation of gas.
Meanwhile, Nigeria’s cooking gas market tipped into deficit.
Supply, which stood at 5,110 MT/day in January and 4,703 MT/day in February, failed to keep pace with demand in March, where 4,726 MT/day supply lagged behind 5,122 MT/day consumption, resulting in approximately 400 MT/day shortfall.
This tightening supply to demand balance has sustained high retail prices—ranging from ₦950/kg to ₦1,550/kg during the quarter—forcing many households to revert to alternative fuels such as charcoal and firewood.
Commercial gas supply showed moderate volatility, rising from 0.573 bscf/day in January to 0.628 bscf/day in February, before easing to 0.601 bscf/day in March, showing uncertainty in supply planning for commercial users—particularly in emerging segments such as CNG-based transportation.
In contrast, supply to gas-based industries—including fertilizer, petrochemicals, and manufacturing—remained largely flat at 0.431 bscf/day in January, 0.440 bscf/day in February, and 0.430 bscf/day in March, pointing to stagnation in industrial feedstock availability.
This suggests that constraints are driven less by processing capacity and more by inconsistent and unreliable gas allocation.
Despite the Petroleum Industry Act’s intent to safeguard domestic supply through delivery obligations, findings indicate these commitments are increasingly being sidelined, as export-oriented allocations take precedence.
On the export front, combined flows through NLNG and the West African Gas Pipeline averaged about 0.156 bscf/day in Q1, reinforcing the steady outward push.
The LNG shipments alone grew by 6.4%, rising from 52,857 MT/day in January to 56,241 MT/day in March, outpacing every domestic segment.
Overall, Q1 2026 data points to a structurally imbalanced gas system, where stable production masks a deeper allocation crisis—one that is redistributing energy away from domestic economic use toward external markets, with significant implications for power reliability, industrial growth, and household energy security.
Barrister Maximillian Ezeude, an oil and gas energy lawyer, says Nigeria’s Q1 2026 gas challenge is not about production but misallocation.
He said, “Despite adequate supply, gas is increasingly directed toward exports, with volumes to NLNG rising each month, while gas-to-power declined steadily and domestic segments faced constraints.”
He pointed to a pattern of inefficiencies—idle processing capacity alongside overstretched facilities, stalled evacuation pipelines, and a shift of cooking gas into deficit—arguing that, taken together, these trends reflect a system prioritising short-term revenue over medium- to long-term industrial and social stability.
Ezeude questioned whether Domestic Gas Delivery Obligations (DGDO) are being implemented as intended under the Petroleum Industry Act (PIA) noting that a 25% drop in gas-to-power alongside rising export feed raises serious concerns about compliance in both volume and pricing.
While the regulator’s data does not provide explicit answers, he said it establishes a clear basis for scrutiny by the Ministry and National Assembly.
He therefore emphasised that the real issue is “where the molecules go, at what price, to whose benefit, and under whose legal obligation,” warning that power, manufacturing, and households are already bearing the cost of an allocation trend the law was designed to prevent.
“The data exists; the legal framework is clear—what remains is enforcement and transparency,” he said.